F
und
fact
sheet
38
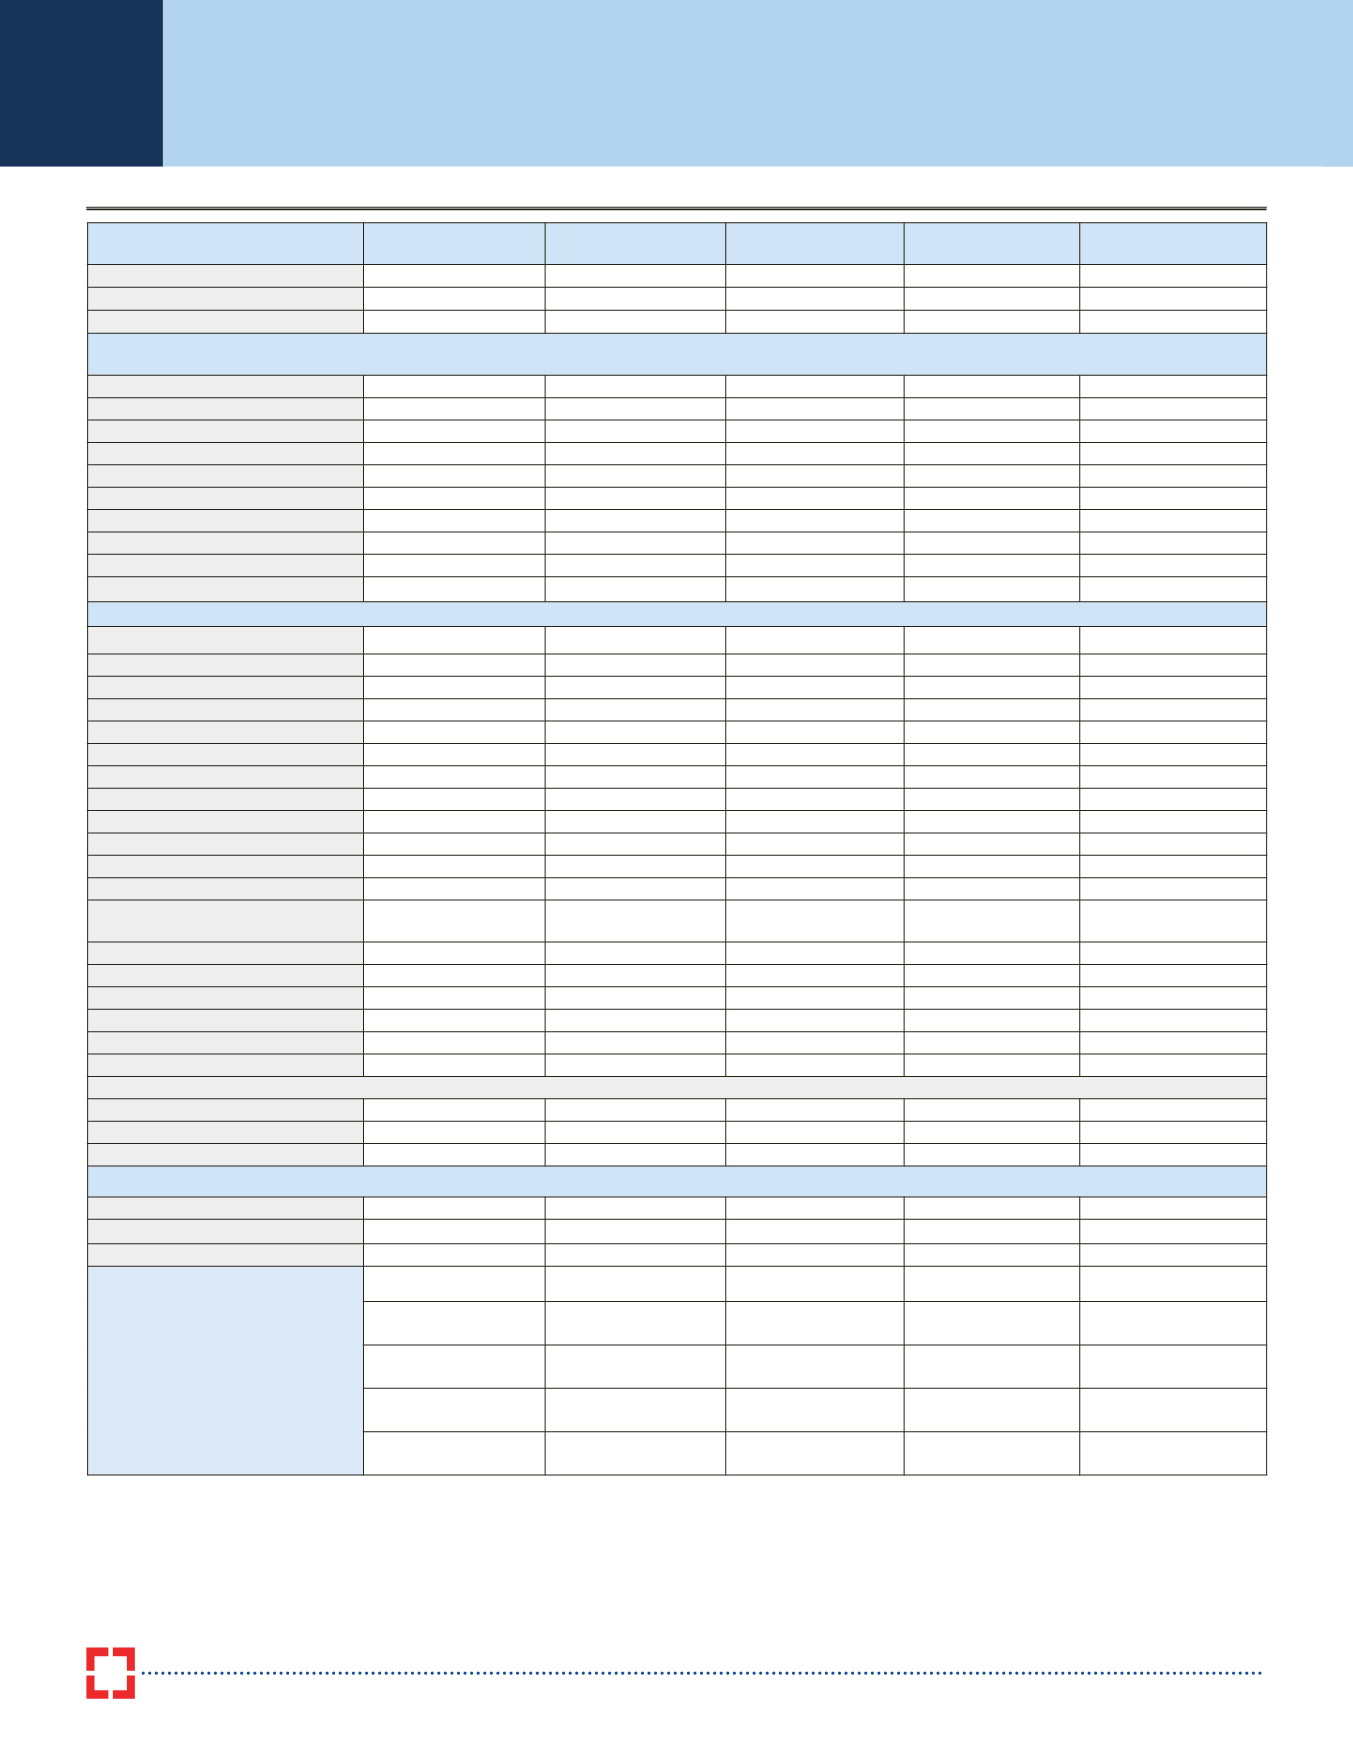
Equity Funds
As on 31
st
January, 2017
Source for entire data stated above is ICRA Online Ltd. (For Disclaimer of ICRA Online Ltd, refer
)
Note: Return figures for all schemes are absolute for <= 1 year and compounded annualised for > 1 year. Past returns cannot be taken as an indicator of future performance.
*If redeemed before 1 year. # If redeemed before 12 months. $If redeemed before 365 Days
~ If redeemed between 0 Month to 6 Month; Exit Load is 1%If redeemed between 6 Month to 12 Month; Exit Load is 0.5%
^ If units purchased or switched in are redeemed or switched out upto 10% of units within 1 Year from the date of allotment - Nil.If units purchased or switched in are redeemed or switched out more than 10% of units within 1 Year
from the date of allotment - 1% of applicable Net Asset Value (NAV).If units purchased or switched in are redeemed or switched out after 1 Year from the date of allotment - Nil.
All the NAVs and return calculation are for the Growth Oriented Plans, unless mentioned otherwise.
As per SEBI circular dated September 13, 2012, fresh subscriptions/switch-ins will be accepted only under a single plan for all the schemes w.e.f from 1st October 2012.
Name of Fund
Birla Sun Life Equity
Fund
DSP BlackRock
Opportunities Fund
SBI Magnum Multi
Cap Fund
Franklin India Prima
Plus Fund
ICICI Prudential
Dynamic Plan
Inception Date
27-Aug-98
16-May-00
29-Sep-05
29-Sep-94
31-Oct-02
Corpus (in
R
Cr)
3770.47
1478.27
1546.60
9930.34
6076.67
NAV (
R
)
586.74
177.51
37.29
481.22
216.52
Returns
S&P BSE Sensex Index
1 Month 3.75%
6.70%
7.34%
4.72%
5.00%
5.28%
3 Months - 0.97%
-1.33%
-0.60%
-3.00%
-2.23%
3.70%
6 Months -1.40%
8.00%
4.40%
-0.34%
0.08%
8.41%
1 Year 11.11%
30.33%
26.04%
17.42%
15.45%
24.25%
3 Years 10.46%
27.14%
23.86%
25.42%
23.11%
18.19%
5 Years 9.96%
20.80%
18.24%
19.56%
18.01%
16.38%
Since Inception --
24.70%
18.77%
12.30%
18.92%
24.06%
Exit Load
1%$
1%#
1% ~
1%*
1% ^
Dividend Pay-out (Latest)
77.00%
26.00%
19.00%
25.00%
22.50%
Dividend Date
30-Nov-16
6-Jan-17
29-Dec-16
26-Feb-16
21-Oct-16
Portfolio Composition Sectors
Auto & Auto Ancillaries
7.24%
6.47%
9.22%
10.88%
6.50%
Banks & Finance
25.70%
27.60%
26.04%
28.79%
12.25%
Capital Goods
1.39%
2.83%
1.54%
2.91%
0.13%
Cement
5.59%
3.73%
3.19%
5.08%
0.12%
Chemicals & Fertilizers
4.40%
0.68%
2.26%
0.31%
6.65%
Housing & Construction
0.00%
7.60%
6.28%
4.52%
2.05%
IT
6.24%
6.64%
9.32%
10.24%
9.41%
Media
1.89%
0.57%
1.79%
1.11%
0.51%
Metals
3.42%
7.81%
2.49%
1.09%
6.84%
Oil & Gas, Energy
9.27%
14.71%
10.08%
3.06%
7.21%
Telecom
3.70%
0.00%
1.66%
5.62%
9.18%
Textiles
0.31%
1.25%
2.51%
1.56%
2.65%
Transport & Shipping , Logistics &
Services
0.80%
0.53%
1.63%
1.35%
5.06%
Defensive
17.97%
14.47%
18.12%
18.49%
14.06%
FMCG
8.11%
7.52%
11.24%
10.62%
6.10%
Pharma
9.86%
6.95%
6.88%
7.87%
7.96%
Other Equities
0.00%
0.00%
0.00%
0.00%
0.00%
Fixed Income Investments
7.72%
0.07%
0.00%
0.00%
7.36%
Current Assets
4.35%
5.06%
3.87%
4.99%
10.01%
Market Capitalization (%)
Large Cap
75.86%
79.40%
70.65%
83.11%
62.84%
Mid Cap
9.97%
9.52%
18.40%
10.67%
9.56%
Small Cap
2.11%
5.95%
7.08%
1.23%
10.23%
Concentration of Stocks
% of Assets
Top 5
18.96%
20.81%
19.83%
23.26%
27.50%
Top 10
32.89%
35.81%
34.79%
38.04%
45.32%
Top 5 Stocks
HDFC Bank Ltd
ICICI Bank Ltd
HDFC Bank Ltd
HDFC Bank Ltd
Bharti Airtel Ltd
Cairn India Ltd State Bank of India Ltd State Bank of India Ltd ICICI Bank Ltd Power Grid Corporation
of India Ltd
Tata Chemicals Ltd
HDFC Bank Ltd Mahindra & Mahindra
Financial Services Ltd Bharti Airtel Ltd
Tata Chemicals Ltd
Maruti Suzuki India Ltd
Yes Bank Ltd
Equitas Holdings Ltd IndusInd Bank Ltd
ICICI Bank Ltd
Dr Reddys Laboratories
Ltd
IndusInd Bank Ltd
Infosys Ltd
Yes Bank Ltd
Infosys Ltd


