30
M
arket
O
verview
:
16 J
anuary
2017
to
14 F
ebruary
2017
Equity Market Round-up
The domestic benchmark indices - the S&P BSE Sensex and the Nifty 50 – rose sharply
during the above mention period and ended with gains of 4.0% YoY and 4.7% YoY, respectively.
The S&P BSE Midcap index and the S&P BSE Smallcap index ended the period with gain of
5.6% MoM and 5.9% MoM, respectively. Among the sectoral indices, the S&P BSE Cons.
Durable index and S&P BSE Realty index were the top performers, gaining by 11.5% MoM and
8.9% MoM, respectively. The top two underperformers were the S&P BSE Healthcare index
which fell marginally by 0.2% MoM and the S&P BSE IT index which grew by 2.1% MoM.
During the month of January 2017, foreign portfolio investors (FPI) were net sellers to the tune
of ~
R
7.3 bn and domestic institutional investors (DII) were net buyers to the tune of ~
R
52 bn.
The market was on an upward trajectory during the above mention period on the back of stability
in commodity prices, steady Q3FY17 corporate earnings, improving FPI flows towards the end
of the period and presentation of a balanced Union Budget focusing on quality government
spending and fiscal consolidation.
During the above mentioned period, the US markets ended on a positive note. The S&P 500
index and Dow Jones index rose by 2.8% MoM and 3.1% MoM, respectively. While the US
economic data points continued to show improvement, the various executive orders on matters
ranging from immigration to infrastructure spending by US President Donald Trump brought
some concerns of rising protectionism in the US. In addition, recently the Fed Chair Janet Yellen
hinted at faster rate hike in US by stating that waiting too long to raise interest rates would be
unwise, given the rise in inflation and economic growth. Going ahead the markets are likely to
focus more on Trump’s trade policies and guidance on interest rate hike cycle by the US Fed.
The domestic macro-economic data points were largely positive during the month. Consumer
Price Index based inflation for January 2017 came in at 3.17% YoY compared to 3.41% YoY
in December 2016. The eight core sector industries (contributing ~38% of the IIP) grew
5.6% YoY in the month of December 2016 vs a growth of 4.9% YoY in November 2016. The
Centre’s fiscal deficit in the first nine months of the current financial year (April-December 2016)
touched 93.9% of the FY17BE, compared to 87.9% at this point of time in the corresponding
year-ago period. India’s merchandise exports expanded for the fourth consecutive month in
December 2016 by 5.72% YoY, while imports increased marginally by 0.46% YoY resulting
in trade deficit declining to $10.4 bn from $13 bn the previous month. Index of Industrial
Production (IIP) contracted marginally by 0.4% YoY in December 2016 as compared to a growth
of 5.7% YoY in November 2016. Wholesale Price Index based inflation for January 2017 came
in at 5.25% YoY compared to 3.39% YoY in December 2016.
In recent Bi-monthly Monetary Policy 2016-17, RBI kept the key policy rates unchanged,
however, RBI changed the policy stance from Accommodative to Neutral to assess the
transitory effects of demonetization on inflation and how the output gap plays out going forward.
The RBI projected that the GVA growth for FY18 could be to the tune of 7.4% which is at the
higher end of the Government’s GDP growth projection. With the ample liquidity in the banking
system due to the money collected by the banks in the demonetization exercise, the change in
stance by the RBI may not negatively impact the equity markets or the ability of the banks to
lend at lower rates in the near to medium term. On the other hand steady corporate earnings
in Q3FY17 with no major negative surprise boosted the market sentiment as the management
of various companies highlighted that the demand situation post demonetization is improving
gradually and may also witnessed gradual shift from unorganized to organized sector. Hence we
think in the medium to long term, the corporate earnings are likely to grow faster on the back
of increased formalization of the economy which will improve the market share for organized
players. In addition rising urbanization, favorable demographics and improving global growth
would also support the corporate earnings growth.
The fund managers are of the view that benign inflation, lower interest rates, normalcy of new
currency notes in circulation and gradual rise in wage level creates favourable condition for
recovery in aggregate consumption demand in FY18.
Investment Strategy: We continue to remain positive on the long-term outlook on the
Indian equity markets and believe that investors should invest into equities in line with
their risk profile. We recommend investors to look at a mix of Large-Cap, Flexi-Cap and
Balance funds with an investment horizon of 2-3yrs. The investment strategy should be
70% lumpsum and rest should be staggered over the next 2-3 months.
Source for entire data stated above is ICRA Online Ltd. (For Disclaimer of ICRA Online Ltd, refer
.
com/legal/standard-disclaimer.html)
Note:- The returns chart shown above is as on 14 February 2017
Source for entire data stated above is ICRA Online Ltd. (For Disclaimer of ICRA Online Ltd, refer
/
legal/standard-disclaimer.html)
Debt Market Round-up
System liquidity conditions improved during the period as funds continued to remain in the
banking system on account of RBI’s restrictions on cash withdrawals. Higher deposit growth in
the banking system amidst muted credit off-take also supported the system liquidity conditions.
The daily average system liquidity as measured by RBI’s Liquidity Adjustment Facility (LAF)
was at a surplus of
R
~2.97 trillion during the period compared with a surplus of
R
~1.53
trillion during the previous period. Absence of issuance of cash management bills (CMBs) under
Market Stabilization Scheme (MSS) also aided the rise in liquidity surplus during the period.
Tracking the liquidity conditions, the overnight call money rates turned volatile and hovered in
the range of 5.75%-6.25%.
Domestic government securities turned volatile tracking global & domestic events and news
flows, and closed on a negative note during the period. The yield on the new 10 year benchmark
G-sec, 6.97% 2026 bond, rose sharply and closed at 6.88% as of 14th February 2017 as against
6.42% as of 13th January 2017, while the yield on the old 10 year benchmark G-sec, 7.59%
2026 bond closed at 7.03% levels as against 6.56%. In the initial part of the period anticipation
over the outcome of the Union Budget for FY18. RBI’s 6th Bi monthly monetary policy and
caution regarding the economic policies of the US President Donald Trump, led the G-sec yields
to trade in a narrow range. US Federal Reserve Chair Janet Yellen’s hawkish comments in a
speech also led to the rise in the bond yields. Intermittently G-sec yields declined tracking the
rise in the system liquidity surplus, decline in the US treasury yields and some strength in the
Rupee against the USD. In another development, the RBI, in consultation with the government
converted four securities from its portfolio maturing in 2017-18 having total face value of about
R
370.78 bn to longer tenor securities maturing in 2024-25 and 2029-30. This led to positive
market sentiments, as the market participants expected that this conversion will reduce the
gross market borrowing for FY18. In the second half of the period the bond yields rose sharply.
Post the announcement of the Union Budget for FY18 the G-sec yields rose marginally as though
fiscal prudence was maintained and the government’s market borrowing were kept almost at
the previous year’s levels, there were no positive surprises in the Union Budget FY18. However
G-sec yields rose sharply following negative sentiments after the announcement to the RBI’s
6th Bi monthly monetary policy. In the monetary policy, the monetary policy committee
(MPC) decided to keep the interest rates unchanged and shifted the policy stance from
“accommodative” to “neutral”. The change in stance of the MPC led to negative sentiments in
the bond markets, as it led the market participants to believe that the scope for further rate cuts
has diminished. Apart from the change in stance, the MPC also sounded cautious on inflation,
categorically highlighting upside risks to inflation in the near term.
The domestic Consumer Price Index (CPI) based inflation continued to decline for the sixth
straight month on back of sharp decline in the food inflation. The headline CPI inflation for
January 2017 came in at 3.17% YoY compared with 3.41% YoY in December 2016 and 5.69%
YoY in January 2016. The decline in headline CPI inflation was primarily due to the fall in
food inflation, which was mainly driven by the contraction in Vegetables and Pulses inflation.
The Consumer Food inflation came in at 0.53% YoY in January 2017 as against 1.37% YoY in
December 2016. Core CPI inflation continued to be sticky and it rose in January 2017 compared
to the readings in December 2016. Core CPI for January 2017 came in at 5.07% as against
4.90% as of December 2016.
Banks’ aggregate credit growth as of 20th January 2017 stood at 5.9% YoY as against 10.9%
YoY as of the same period last year; whereas banks’ deposit growth continued to remain
healthy at 13.9% YoY as against 10.50% YoY as of the same period last year.
As per most of the fixed income fund managers, RBI’s shift in the monetary policy stance was
unwarranted given the improvment in fiscal deficit, impact of demonetization, lower inflation
and muted credit growth. The fund managers also believe that bond yields will be range bound
and any further policy rate moves would be data dependent.
Investments in Short Term Funds can be considered with an investment horizon of
12 months. Investment into Medium Term Funds with an investment horizon of over
15 months can be considered by moderate and conservative investors. Income/Duration
Funds can be considered by aggressive investors for a horizon of 24 months and above;
though preference currently should be given to dynamically managed funds. Investors
looking to invest with a horizon of 1 to 3 months can consider Liquid Funds, while Ultra
Short Term Funds can be considered for a horizon of 3 months and above.
0%
2%
4%
6%
8%
10%
12%
14%
16%
USTF Floaters
STP's
Income
Gilt
MIP's
Absolute Returns (%)
3 Months
6 Months
12 Months
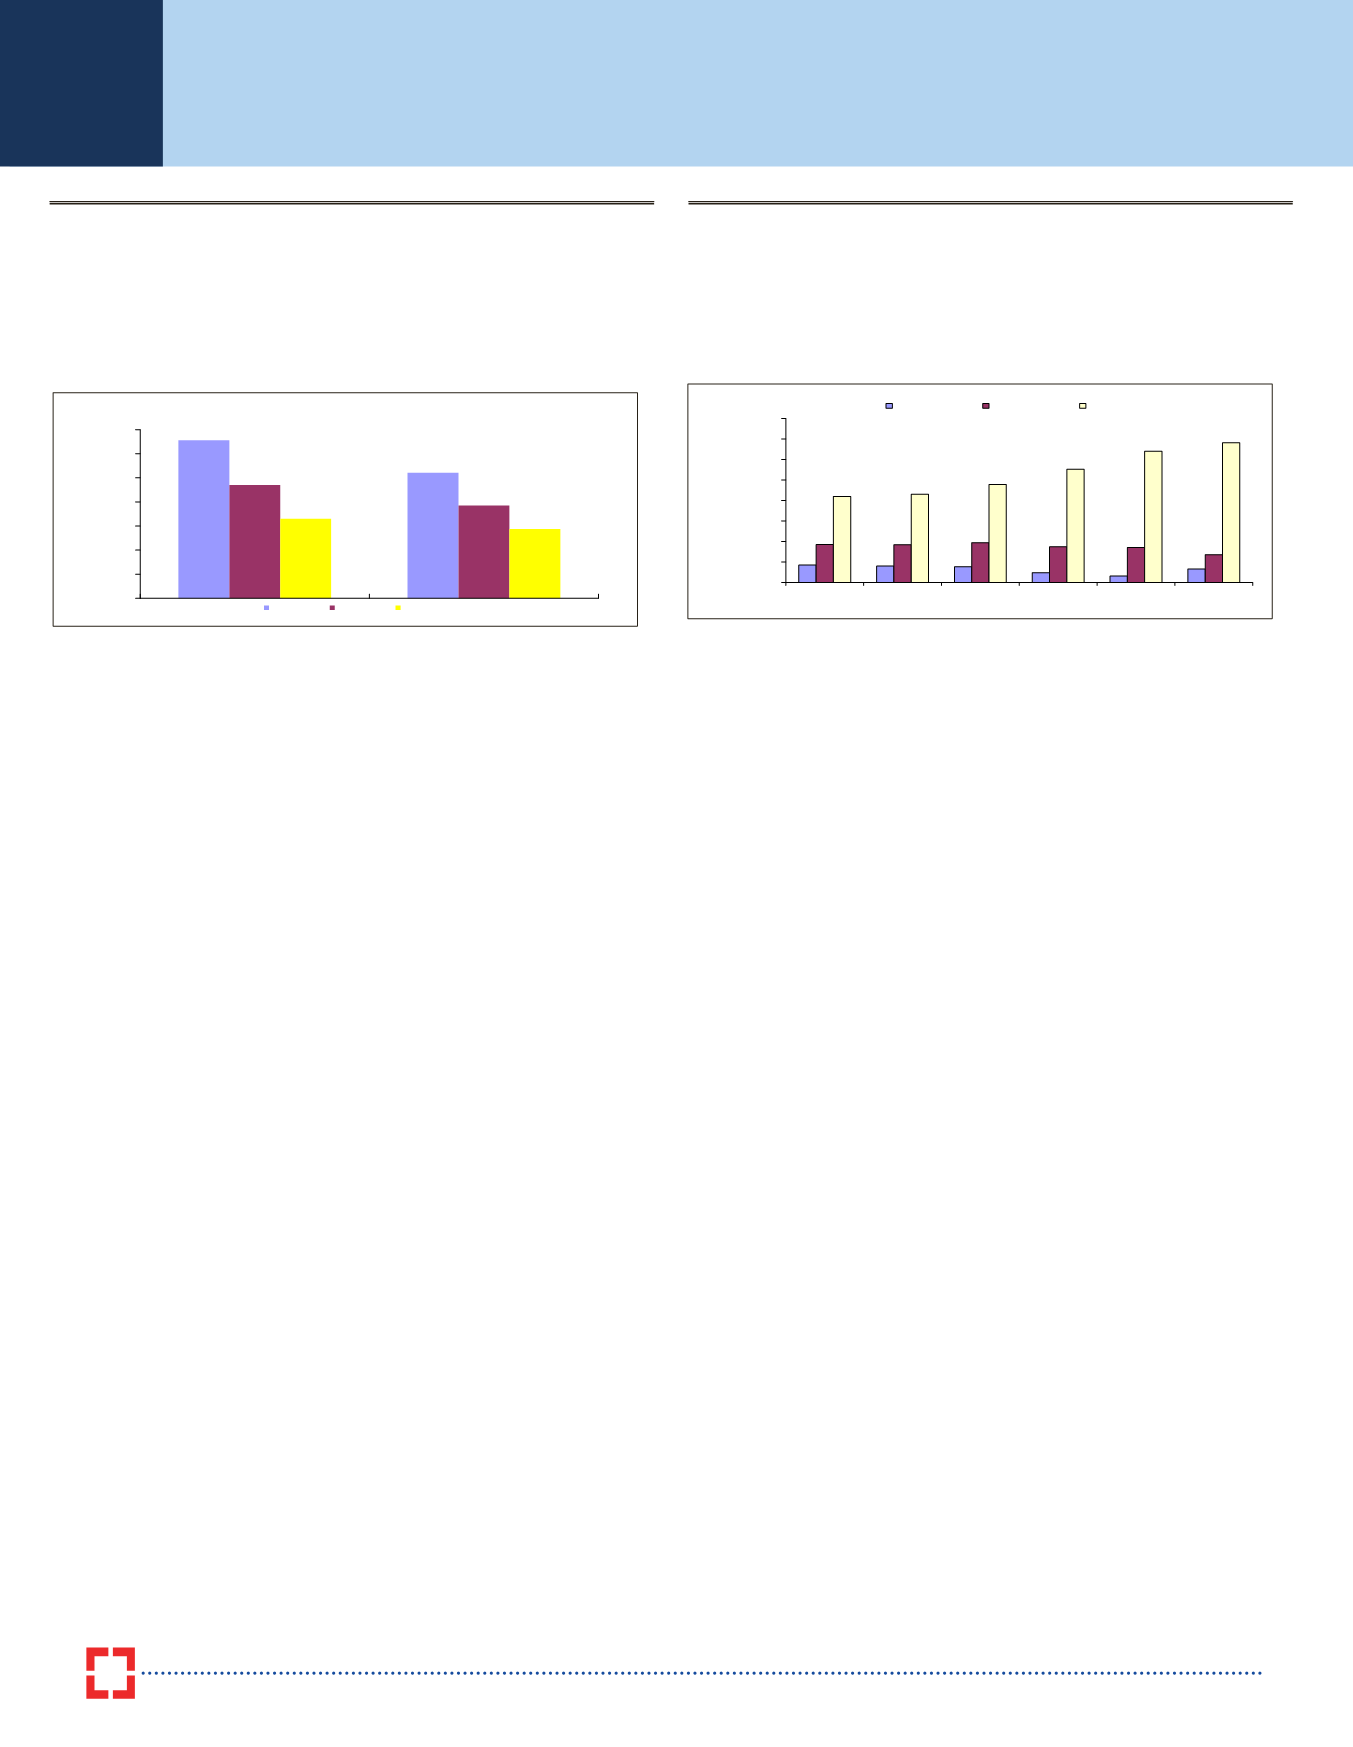
0%
5%
10%
15%
20%
25%
30%
35%
Equities
Balanced
CAGR Returns
1yr
3yr
5yr
as on 14 February 2017


