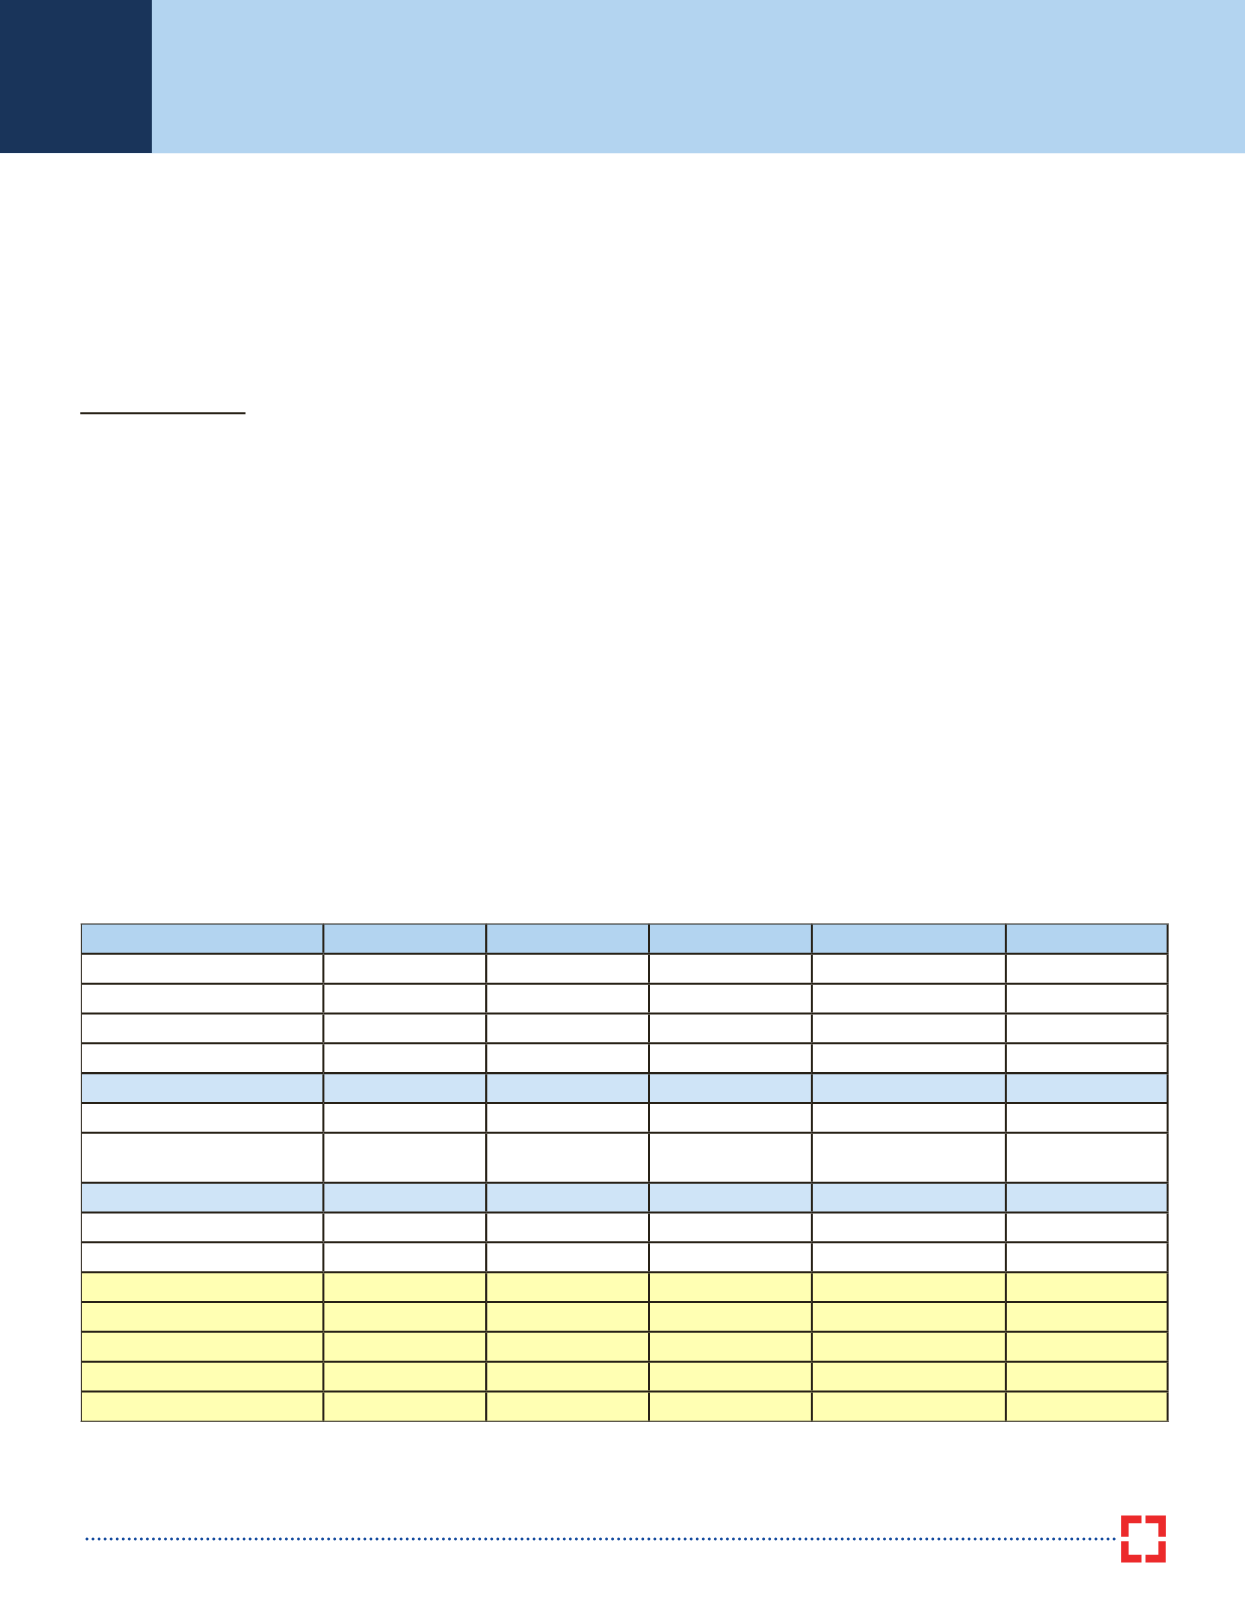
15
Particulars
R
Bn
2015-16 Actuals
2016-17 BE
2016-17 RE
2017-18 BE
% Change
A. Revenue Receipts
11950.25
13770.22
14235.62
15157.71
6.48%
Tax Revenue (net to centre)
9437.65
10541.01
10887.92
12270.14
12.69%
Non-tax Revenue
2512.60
3229.21
3347.70
2887.57
-13.74%
B. Capital Receipts
5957.48
6010.38
5908.45
6309.64
6.79%
Total Receipts (A+B)
17907.83
19780.6
20144.07
21467.35
6.57%
C.Scheme Expenditure
7251.14
8019.66
8698.47
9450.78
8.65%
D.Expenditure on Other
than Schemes
10656.69
11760.94
11445.6
12016.57
4.99%
Total Expenditure (C+D)
17907.83
19780.6
20144.07
21467.35
6.57%
Revenue Expenditure
15377.61
17310.37
17345.6
18369.34
5.90%
Capital Expenditure
2530.22
2470.23
2798.47
3098.01
10.70%
Revenue Deficit
3427.36
3540.15
3109.98
3211.63
3.27%
as a % of GDP
-2.5
-2.3
-2.1
-1.9
Fiscal Deficit
5327.91
5339.04
5342.74
5465.32
as a % of GDP
-3.9
-3.5
-3.5
-3.2
GDP
136613
152544
150754
168475
Budget at glance
* All figures in
R
Bn except the YoY % figures
10 year benchmark G-secs inched up and ended almost 1-2 bps
higher than the previous day’s closing levels.
The bond markets
remained at the sidelines post the budget announcements due
to lack of any positive surprises on fiscal deficit as well as net
borrowings in the Union Budget for FY18.
The yield on the old
10-year benchmark G-sec (7.59% GS 2026) rose by 1 bp, to end
at 6.55%; while the yield on the new 10-year benchmark G-sec
(6.97% GS 2026) rose by 2 bps to close at 6.43%.
Investment Strategy
The Union Budget for FY18 has maintained fiscal prudence
amidst limitations of slow private spending and push for
public spending.
The estimated gross and net market borrowings
of Central Government for FY18 have also remained broadly
unchanged from the revised borrowings in FY17.
This may not
lead to any significant rise in the net supply of G-secs in FY18
compared to FY17. This may mean that the overall supply of
G-secs in FY18 is likely to depend upon the net borrowings
from State Governments. Over the last five financial years
as of FY16, the combined borrowings of Central and State
Governments have been rising consistently every year.
However, higher deposit growth and muted credit growth is likely
to be favourable for the demand-supply dynamics.
The focus of the domestic fixed income markets will now shift
to the monetary policies from US FOMC and RBI. The hawkish
remarks by the US Federal Reserve Chair, Janet Yellen, in the
recent past have raised the market expectations of faster pace
of rate hikes in the US. This may lead to turbulence in global
financial markets and may impact foreign portfolio flows in
to Indian capital markets.
FPIs have been net sellers of Indian
bonds over the last four months as of January 2017. If such selling
continues then it is likely to increase the volatility in the Indian
G-secs. However, in such scenarios, domestic demand may limit
any sharp rise in the bond yields. Further, any reversal of FPI flows
is positive for bond yields.
Headline CPI inflation has moderated sharply in the recent
past on back of sharp decline in food inflation over the last
4 months. Rise in commodity prices, full implementation of
7th Pay Commission and implementation of GST poses upside
risks to inflationary expectations.
Further sticky core inflation
also remains a cause of concern for the RBI. However, higher
sowing of Rabi crops is likely to keep the food inflation benign.
This along will global financial volatility as mentioned above may
impact RBI’s monetary policy decisions.
Investments in Short Term Funds can be considered with an
investment horizon of 12 months. Investment intoMedium Term
Funds with an investment horizon of over 15 months can be
considered by moderate and conservative investors. Income/
Duration Funds can be considered by aggressive investors for
a horizon of 24 months and above; though preference currently
should be given to dynamically managed funds. Investors
looking to invest with a horizon of 1 to 3 months can consider
Liquid Funds, while Ultra Short Term Funds can be considered
for a horizon of 3 months and above.
T
he
U
nion
B
udget
2017-18


