E
quity
round
-
up
4
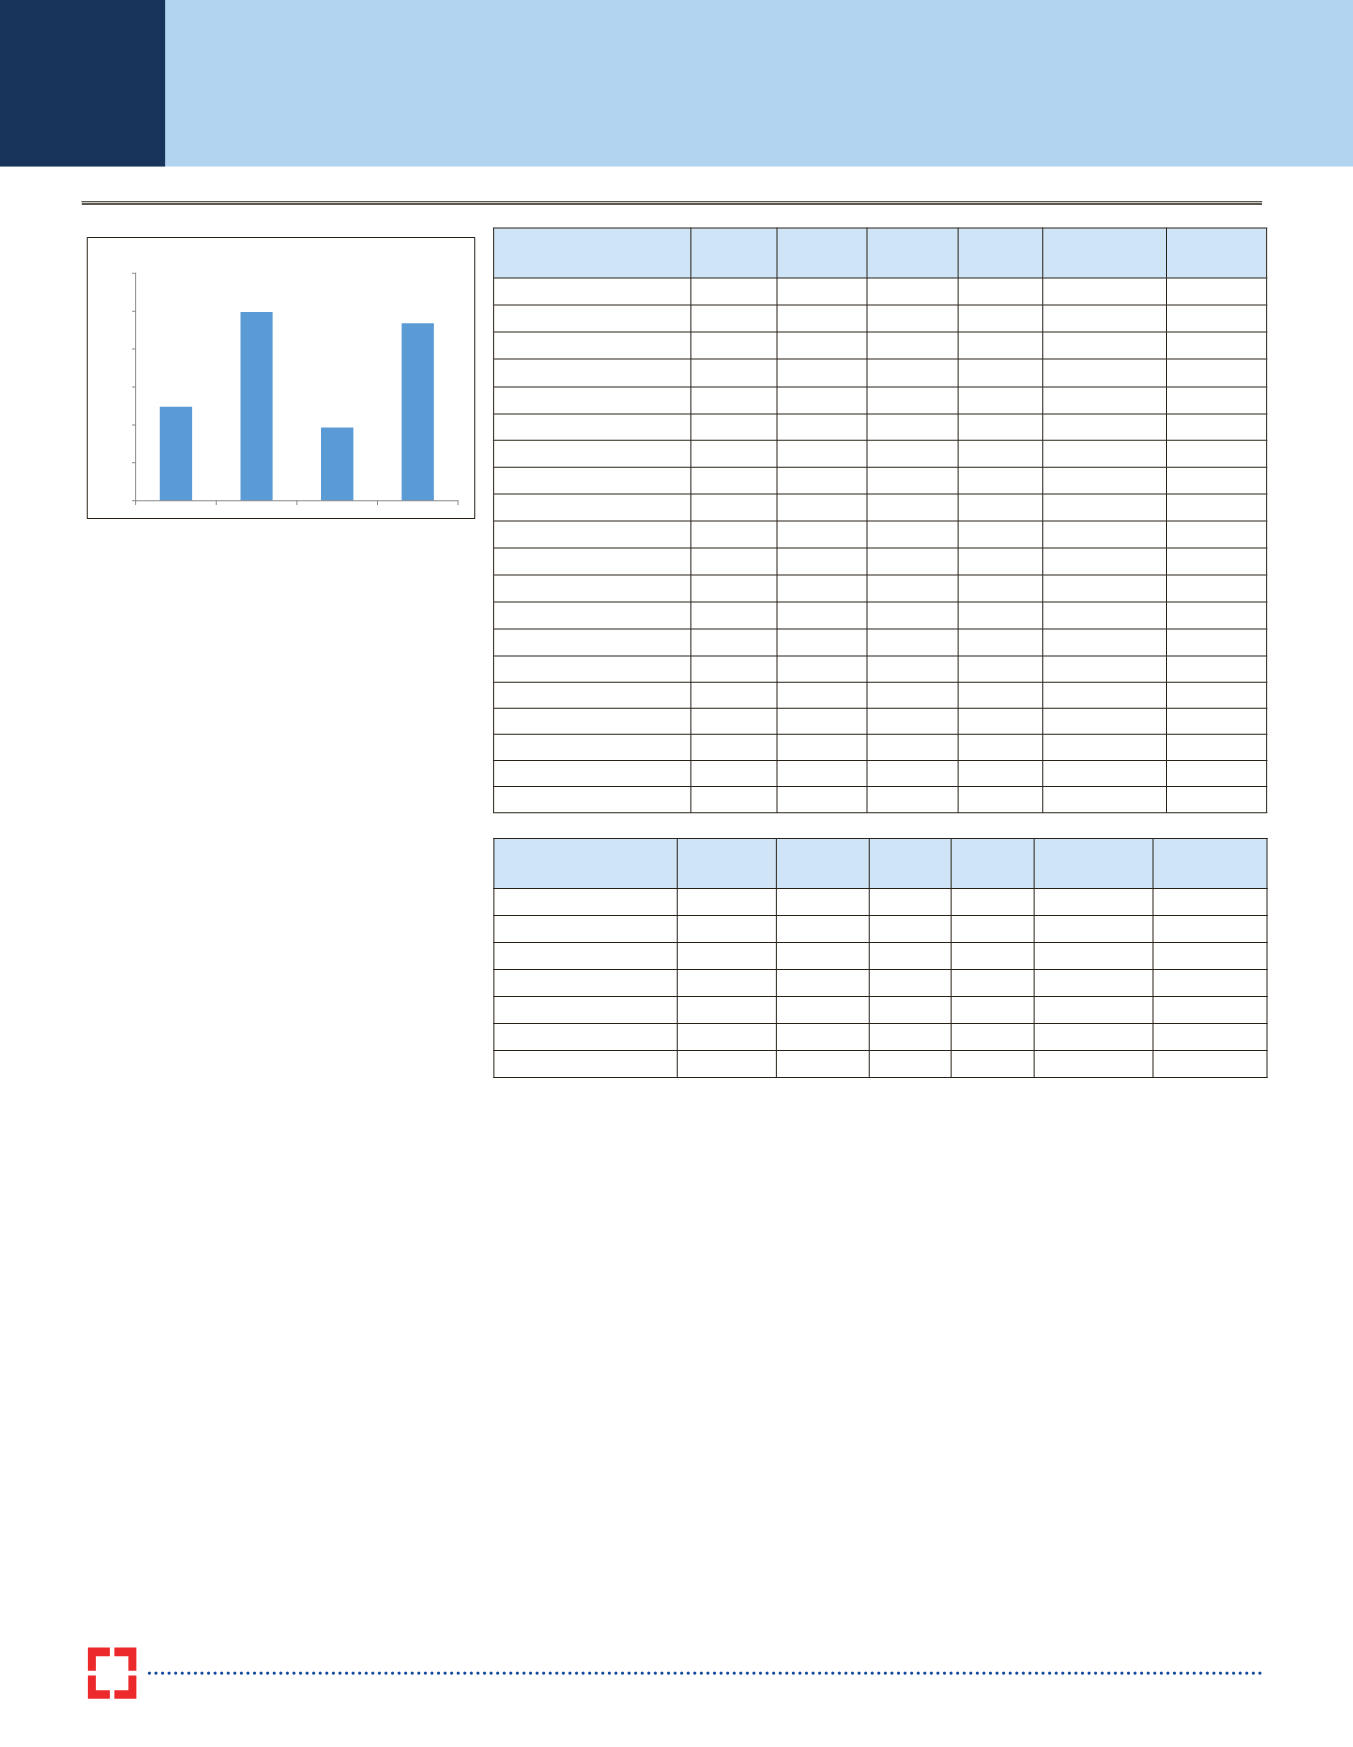
Sensex Movement
16 January 2017 to 14 February 2017
The domestic benchmark indices - the S&P BSE Sensex and the
Nifty 50 – rose sharply during the above mention period and ended
with gains of 4.0% YoY and 4.7% YoY, respectively The market was on
an upward trajectory during the above mention period on the back of
stability in commodity prices, steady Q3FY17 corporate earnings,
improving FPI flows towards the end of the period and presentation
of a balanced Union Budget focusing on quality government spending
and fiscal consolidation. The S&P BSE Midcap index and the
S&P BSE Smallcap index ended the period with gain of 5.6% MoM and
5.9% MoM, respectively. Among the sectoral indices, the S&P BSE Cons.
Durable index and S&P BSE Realty index were the top performers, gaining
by 11.5%MoM and 8.9%MoM, respectively. The top two underperformers
were the S&P BSE Healthcare index which fell marginally by 0.2% MoM
and the S&P BSE IT index which grew by 2.1% MoM.
Key macro data released during the period included the following:
1) Consumer Price Index based inflation for January 2017 came in at
3.17% YoY compared to 3.41% YoY in December 2016; 2) The eight core
sector industries (contributing ~38% of the IIP) grew 5.6% YoY in the
month of December 2016 vs a growth of 4.9% YoY in November 2016;
3) The Centre’s fiscal deficit in the first nine months of the current financial
year (April-December 2016) touched 93.9% of the FY17BE, compared
to 87.9% at this point of time in the corresponding year-ago period;
4) India’s merchandise exports expanded for the fourth consecutive month
in December 2016 by 5.72% YoY, while imports increased marginally by
0.46% YoY resulting in trade deficit declining to $10.4 bn from $13 bn
the previous month. 5) Wholesale Price Index based inflation for January
2017 came in at 5.25% YoY compared to 3.39% YoY in December 2016
and 6) Index of Industrial Production (IIP) contracted marginally by
0.4% YoY in December 2016 as compared to a growth of 5.7% YoY in
November 2016.
During the month of January 2017, foreign portfolio investors (FPI) were
net sellers to the tune of ~
R
7.3 bn and domestic institutional investors
(DII) were net buyers to the tune of ~
R
52 bn.
Majority of global equity indices ended on a positive note in the above-
mentioned period. The US markets ended on a positive note with
the S&P 500 index and the Dow Jones index ending with a gain of
0.9% MoM and 0.5% MoM, respectively. The European markets also
ended on a positive note with Germany’s Dax index and UK’s FTSE
index ending with the gain of 3.4% MoM and 5.6% MoM, respectively.
However, Asian markets ended on the mixed note with Hong Kong’s
HangSeng index and Japan’s Nikkei index ending with the gain of
2.1% MoM and 0.2% MoM, respectively while China’s Shanghai
Composite index ended with the loss of 0.9% MoM.
Domestic Indices
Open High
Low Close Absolute
Change % Change
S&P BSE Sensex
27238 28487 26964 28339
1,101
4.0%
Nifty 50
8391
8827
8327
8792
392
4.7%
Nifty Next 50
22679 24337 22605 23975
1,327
5.9%
Nifty 500
7224
7660
7190
7605
377
5.2%
S&P BSE 200
3627
3834
3607
3811
186
5.1%
S&P BSE 100
8653
9133
8598
9085
435
5.0%
Nifty Midcap 100
15178 16316 15085 16092
913
6.0%
Nifty Smallcap 100
6248
6707
6190
6533
284
4.5%
S&P BSE Bankex
21644 23478 21414 23226
1,569
7.2%
S&P BSE IT
9913 10184
9357 10166
214
2.1%
S&P BSE Auto
21301 22616 21224 21920
659
3.1%
S&P BSE FMCG Sector
8347
9227
8301
8876
535
6.4%
S&P BSE Oil&Gas
12703 13310 12328 13036
372
2.9%
S&P BSE Healthcare
15053 15587 14604 15004
(33)
-0.2%
S&P BSE Cap Goods
14577 15559 14323 15359
774
5.3%
S&P BSE Metal
11262 12053 11102 11621
400
3.6%
S&P BSE Power
2122
2247
2112
2221
100
4.7%
S&P BSE Cons Durable 11998 13743 11988 13384
1,383
11.5%
S&P BSE Infra.
199
206
196
204
5
2.7%
S&P BSE Realty
1360
1512
1347
1472
120
8.9%
Overseas Indices Open
High Low Close Absolute
Change % Change
S&P 500
2273
2338
2257 2338
63
2.8%
Dow Jones Ind Avg
19913
20504 19678 20504
619
3.1%
Dax (Germany)
11537
11893 11425 11772
143
1.2%
FTSE (UK)
7338
7354
7094 7269
(69)
-0.9%
Hang Seng
22895
23752 22657 23703
766
3.3%
Nikkei
19219
19519 18650 19239
(48)
-0.3%
Shanghai Composite
3104
3219
3044 3218
105
3.4%
Sources: Bloomberg, Note: Closing prices of all the above indices are as on 14 February 2017
Source: Bloomberg
26000
26500
27000
27500
28000
28500
29000
Open
High
Low
Close


