50
th
ANNUAL REPORT 2015-2016 THE GEM & JEWELLERY EXPORT PROMOTION COUNCIL
35
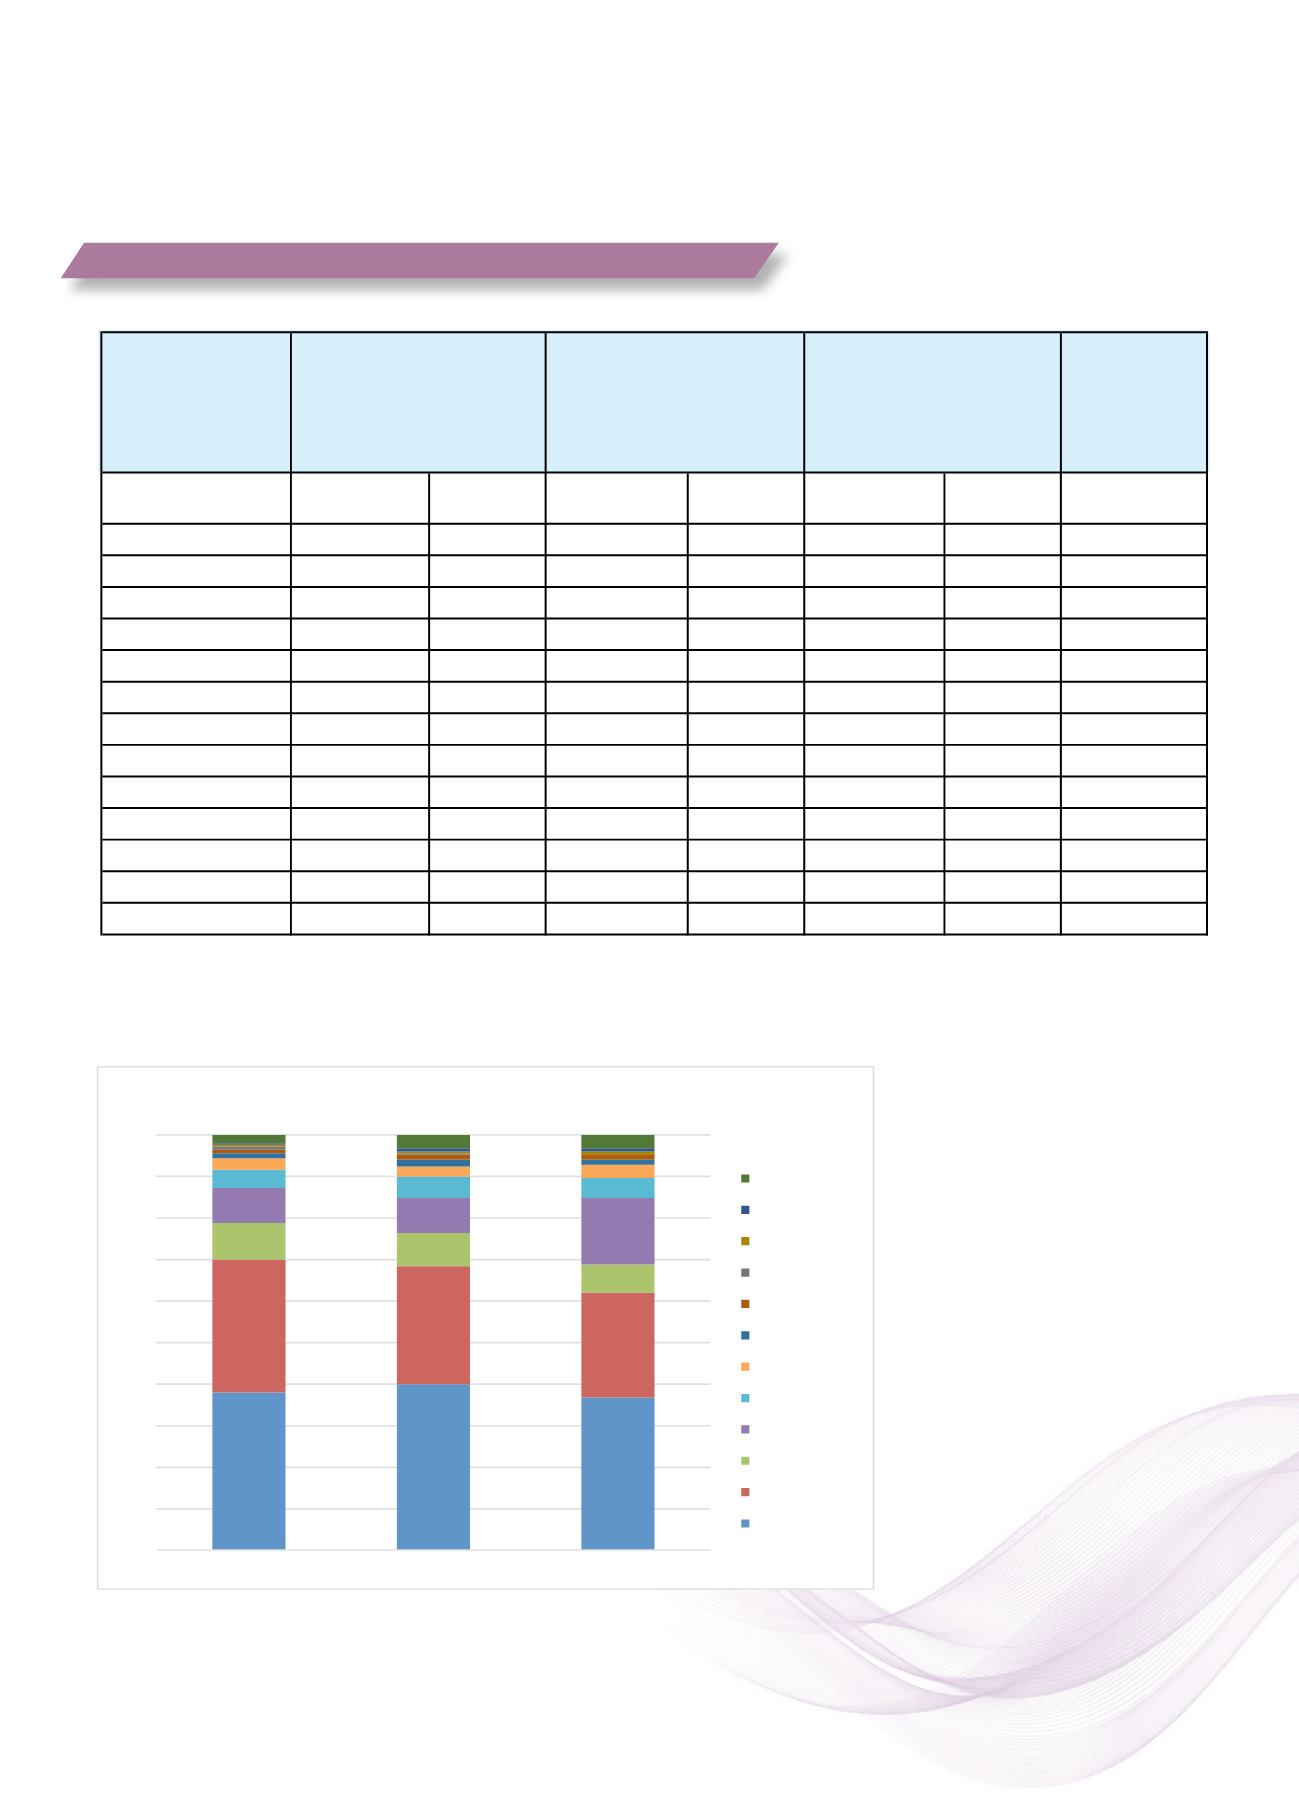
Table 1: Export of Cut & Polished Diamonds to Major Markets
Country
Percent
Growth /
decline over
previous year
US $ in
Millions
%wrt
Total
US $ in
Millions
%wrt
Total
US $ in
Millions
%wrt
Total
US$
Hong Kong
7846.15
37.96
9249.25
39.94
9,030.42
36.86
-‐15.17
U.S.A
6610.99
31.99
6562.57
28.34
6,170.22
25.19
0.74
U.A.E.
1817.09
8.79
1990.36
8.59
3,889.93
15.88
-‐8.71
Belgium
1693.01
8.19
1851.50
7.99
1,633.17
6.67
-‐8.56
Israel
970.27
4.69
1142.07
4.93
1,253.69
5.12
-‐15.04
Thailand
554.16
2.68
617.63
2.67
697.77
2.85
-‐10.28
Japan
216.21
1.05
344.39
1.49
311.56
1.27
-‐37.22
Switzerland
214.59
1.04
239.30
1.03
290.25
1.18
-‐10.33
United Kingdom
115.67
0.56
96.14
0.42
72.85
0.30
20.31
Australia
110.01
0.53
116.98
0.51
121.88
0.50
-‐5.96
Singapore
102.28
0.49
146.00
0.63
205.66
0.84
-‐29.95
Others
417.36
2.02
803.99
3.47
821.08
3.35
-‐48.09
Total
20,667.79
100.00
23,160.18
100.00 24,498.48
100.00
-‐10.76
2015 -‐ 2016 (P)
2014 -‐ 2015
2013 -‐ 2014
The market share Hong Kong in export of cut & polished diamond from India has increased substantially during last 3 years.
0%
10%
20%
30%
40%
50%
60%
70%
80%
90%
100%
2015 -‐ 2016 (P)
2014 -‐ 2015
2013 -‐ 2014
Exports of Cut & Polished Diamonds to major markets
Others
Singapore
Australia
United Kingdom
Switzerland
Japan
Thailand
Israel
U.A.E.
Belgium
U.S.A
Hong Kong
1.Diamonds
Itemwise Exports
Source: Collected from Customs


