50
th
ANNUAL REPORT 2015-2016 THE GEM & JEWELLERY EXPORT PROMOTION COUNCIL
34
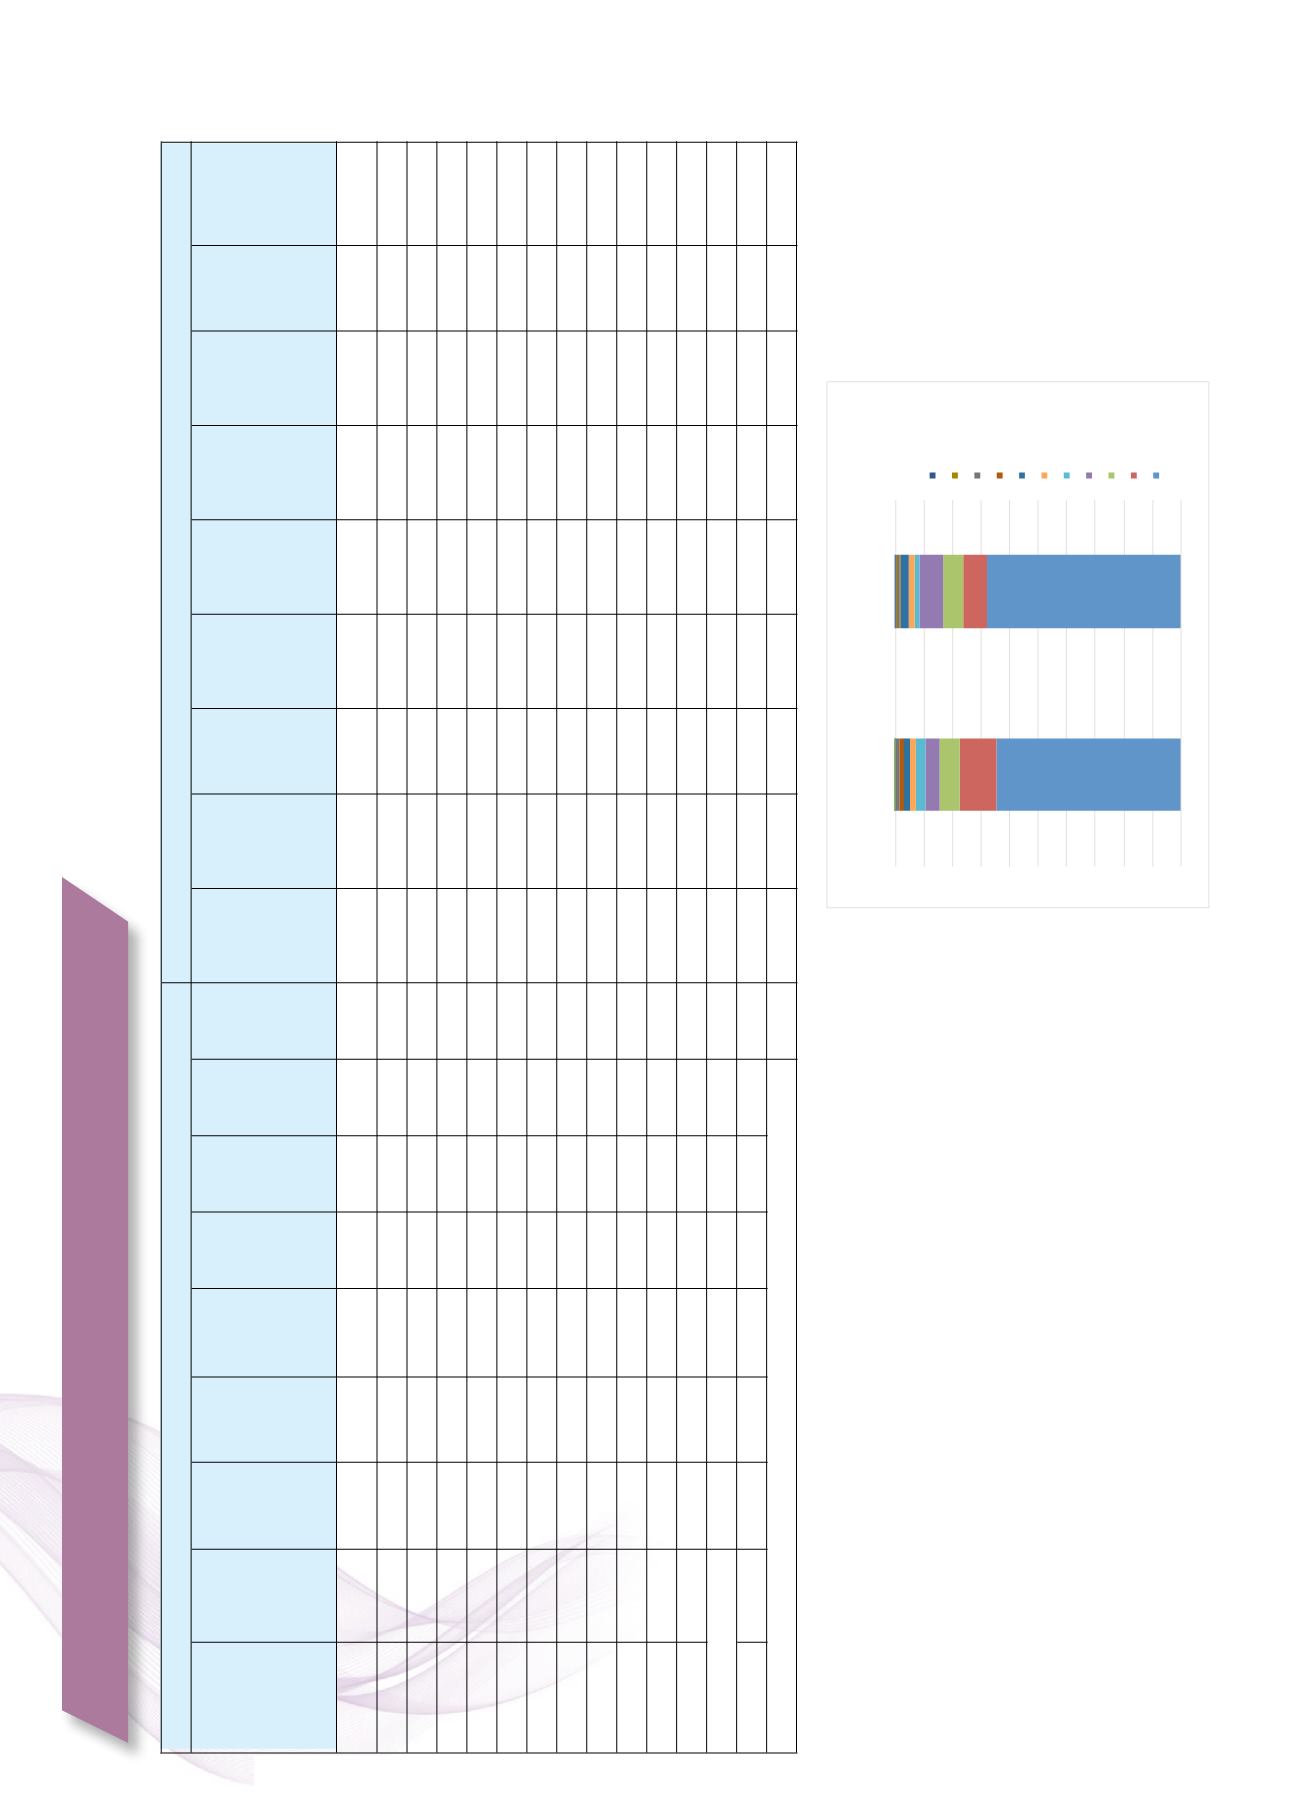
Table 6: Port wise Comparision of Exports of Gem & Jewellery from India
During 2015-16 for same period Last year.
0%
10%
20%
30%
40%
50%
60%
70%
80%
90%
100%
2015 -‐ 2016 (P)
2014 -‐ 2015
PORTWISE EXPORTS OF GEMS & JEWELLERY FROM INDIA
DURING 2015-‐16 COMPARED TO LAST YEAR SAME PERIOD
Vishakhapatnam
Coimbatore
Chennai
Cochin
Kolkata
Jaipur
Hyderabad
Delhi
Surat
Bangalore
Mumbai
Region
US$ Mill
US$ Mill
US$ Mill
US$ Mill US$ Mill US$ Mill US$ Mill
US$
US$ Mill
US$ Mill
US$ Mill
US$ Mill
US$ Mill
US$ Mill
US$ Mill
US$
US$ Mill
Mumbai
20438.75
28.86 3636.38 1291.25 25395.24 6405.76 18989.48 58.20
22751.41
18.98 3093.79 1260.17 27124.35 3537.90 23586.45 72.29
-‐19.49
Bangalore
4.94
0.00
26.95 4997.60 5029.49
5029.49 15.41
3.30
0.01 537.64 2835.11 3376.06
3376.06 10.35
48.98
Surat
189.15
0.43 970.39 1496.00 2655.97
0.50 2655.47 8.14
332.71
0.92 1070.84 1302.71 2707.18
2.77 2704.41 8.29
-‐1.81
Delhi
5.10
1.60 1675.01
364.85 2046.56
2046.56 6.27
6.85
10.88 3213.57
115.99 3347.29
3347.29 10.26
-‐38.86
Hyderabad
2.84
87.27 1152.84 1242.95
1242.95 3.81
2.19
0.00
87.00
597.94
687.13
687.13 2.11
80.89
Jaipur
22.98
402.37 193.26
229.07 847.68 251.81 595.87 1.83
27.84
422.38 190.87
205.07
846.16
219.46
626.70 1.92
-‐4.92
Kolkata
1.39
781.24
7.06 789.69
789.69 2.42
4.21
0.00 1095.77
62.49 1162.47
1162.47 3.56
-‐32.07
Cochin
675.14
40.84 715.98
715.98 2.19
204.27
12.77
217.04
217.04 0.67
229.88
Chennai
0.23
442.21
5.13 447.57
447.57 1.37
1.15
0.07 336.95
2.15
340.32
340.32 1.04
31.51
Coimbatore
69.41
0.29 69.70
69.70 0.21
72.81
0.00
72.81
72.81 0.22
-‐4.27
Vishakhapatnam 2.43
2.50
4.93
4.93 0.02
30.45
69.35
99.80
99.80 0.31
-‐95.06
Sales to Foreign Tourists
40.74
47.37
TOTAL
20667.79
433.26 8557.26 9587.43 39286.50 6658.06 32628.44 100.00
23160.08
453.24 9903.51 6463.75 40027.98 3760.12 36267.86 111.15
-‐10.03
Note: Data for Exports of Diamonds from Mumbai includes Export of C & P Diamonds (Bonded W.H).
2015 -‐ 2016 (P)
2014 -‐ 2015
Region C & P
Diamonds
Col.Gemst
ones
Gold
Jeweller
y
Other
Items
Total
Gross
Exports
Return
Consign
ment
Total
Net
Exports
Return
Consignm
ent
Total Net
Exports
% Share
in Total
Percent
Growth /
decline over
previous year
(Net Exports)
%
Share in
Total
C & P
Diamonds
Col.Gemsto
nes
Gold
Jeweller
y
Other
Items
Total
Exports


